Summary
Chemical Mechanical Planarization (CMP) slurry health or quality control is critical to achieving the lowest defectivity and cost of ownership in current and next generation CMP processing [1]. To maintain CMP slurry health during usage, it is essential to monitor and control slurry’s chemical (e.g., oxidizer and additive levels and their decay behavior) as well as abrasive properties, including Large Particle counts (LPC), mean Particle Size Distribution (PSD), density, weight percentage of solids, viscosity, etc. [2,3]. Currently, there are several technologies and related instruments available in the market, which can measure oxidizer concentration (e.g., H2O2 wt % in slurry+H2O2 blend), LPC, or PSD [4].
However, not many techniques can measure both chemical concentration and abrasive particle characteristics of the slurry in-line, in real-time, and without sampling and dilution.
In this paper, we review the motivation and methods for slurry health monitoring and control with examples from recent data. Development and characterization of a new analyzer based on real-time near infrared (NIR) spectroscopy is presented. This approach can provide oxidizer concentration as well as the abrasive particle information in CMP slurry blends. This works on the principles of chemometrics, which is a two-phase process. In the first “calibration” phase, samples with known property values are measured by the system.
A mathematical procedure then determines the correlation between the measured spectra and the true property values. The output of this phase is a “model” that optimally calculates the parameter values from the measured spectra of the calibration samples. In the second “measurement” phase, unknown samples are measured by the system employing model to produce estimates of the property values.
Presented NIR approach shows the ability to measure H2O2 concentration in a CMP slurry blend, for concentrations of 0-5 % weight to an accuracy of ~0.05 % weight.
Also, this spectroscopic technique demonstrates the ability to detect the concentration of 560 nm PSL microspheres (typical size for agglomerated slurry particles) in presence of 90 nm PSL microspheres (typical for a healthy slurry), in a range from 0 to 0.01 % solids with an accuracy of 0.0001 % solids. A large particle index calculated from NIR data shows a nearly linear relationship with the cumulative large particle counts measured using a single particle optical sensing (SPOS) instrument.
These results were obtained by analysis of silica-based CMP slurry samples with different degrees of agglomeration generated from diaphragm pump slurry handling test. Presented NIR technology with capability of measuring abrasive characteristics as well as oxidizer concentration can be very useful in continuous monitoring and control of slurry health during slurry distribution.
Cmp Slurry Health Monitoring And Control
Oxidizer Concentration, LPC and PSD Measurements
Slurry blend quality or health from the same batch, lot and manufacturer can vary significantly, after blending and during fab distribution, depending on the usage and replenishment cycle, delivery equipment (e.g., various pumping devices and vacuumpressure-dispense system), filtration used, and the number of turnovers slurry goes through before it is consumed [1,5].
It is essential to monitor and control the slurry oxidizer level and particle characteristics during slurry usage for repeatable CMP processing [2,6]. Chemical
concentration measurement is also important in other clear chemical blends such as citric acid, SC1, SC2, DSP, HF/HCl, and HF.
The oxidizer concentration (e.g., H2O2 % wt, NH4OH % wt) in the slurry+oxidizer blend can be measured using autotitration or benchtop titration, ultrasonic analyzers, FT-NIR (Fourier Transform NIR), Filter NIR, conductivity, pH, UV/Vis and IR absorption, and refractive index (RI).
In general, titration based methods require large quantity of consumables (especially if used frequently) and periodic maintenance, and provide intermittent (not in real-time) data of concentration, whereas ultrasonic and refractive index based methods can provide continuous data but may have limitations in multi-component blends (e.g., slurry+H2O2+water) oxidizer level measurements, with required accuracy.
Conductivity measurement may have limited application even when it has good sensitivity for the slurry different component blends, since it is typically not controlled by slurry manufacturers in different lots of same slurry and may also vary with time elapsed after manufacturing during recommended storage time of the slurry. FT-NIR is a complex technology with higher price and slower measurement speed. Chemical concentration can be continuously measured using UV/Vis or IR absorption.
LPC measurements are usually conducted using Single Particle Optical Sensing (SPOS) techniques. These analyzers are based on single particle light scattering, and single particle light scattering and light extinction measurements. PSD measurements are typically made using dynamic light scattering (DLS), multi-wavelength light extinction, electroacoustics, hydrodynamic fractionation, disk centrifuge, and laser diffraction & light scattering based analyzers. DLS based techniques need sampling and dilution and are sensitive to both small and large particles. A detailed comparison of common PSD analyzers is provided in [4]. Mean PSD determines bulk removal rate of the material being polished, whereas LPC relate to the scratches on the wafer. LPC measurements are more important in slurry quality management due to their significant effects on defectivity and yield in CMP processing.
Measurement of LPC can detect excursions in large particle concentration due to various sources such as temperature fluctuations during shipping and transportation, slurry drying and settling, pH shock during blending, and slurry pumping and distribution [1,5]. Optimum filtration can be very useful in LPC management in CMP slurry blends [7,8]. Not many technologies can simultaneously measure information related to the oxidizer concentration as well as large particles in the slurry blends, especially on a real-time, and in-line basis without sampling and dilution.
This paper presents the results of H2O2 concentration, large particle index (LPI) – a measure of large particle concentration in the slurry, and large particle distribution in a silica slurry blend obtained using a novel NIR absorption spectrum based analyzer. This analyzer has an in-line, non-contact flow cell with PEEK body and sapphire windows, and has capability of providing real-time data. Based on the oxidizer concentration measurement in the slurry blend a spiking pump may be activated in the slurry delivery system, dynamically controlling the oxidizer level within target limits [6]. On the other hand, depending on the identified large particle information trend, an appropriate filter change-out time may be scheduled.
A Novel Nir Spectrometer
WetSpec100Ⓡ is a real-time in-line analyzer for chemical concentration measurement in the CMP slurry blends. This system measures the absorption spectra of a fluid sample in NIR wavelength range, which is processed to determine chemical content and particle size information. This unit can be integrated in applications such as slurry health monitoring in CMP slurry blending and distribution systems, etch rate monitoring in wet etch systems, plating bath control in electroplating systems, and chemical waste management. Above NIRsystem focuses light from a halogen lamp through optical fibers to a PEEK flow cell with sapphire windows, which is sent back through optical fibers to a grating-based spectrometer.
The spectrum is measured with an array of photodiodes. A dual fiber optic multiplexer allows for the use of multiple flow cells. For fluids with different opacity, flow cells with varying optical path lengths can be used, whereas for different chemistries, flow cells of different materials need to be used. Typical measurement time is 0.4 sec for clear fluids and slightly more for opaque fluids. A schematic of the system is presented in Figure 1. The unit supports up to 8 flow cells and takes < 1 minute per measurement per flow cell. Typical accuracy of H2O2 concentration in slurry blend is 0.1 % wt.
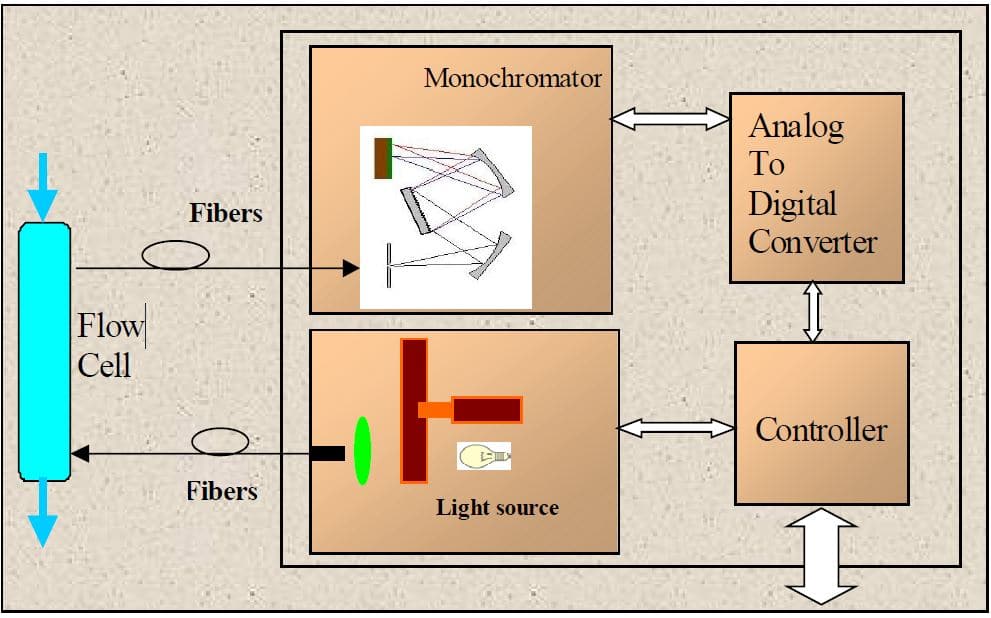
Figure 1. Schematic of Spectroscopic NIR System.
The concentration of fluid constituents is derived from changes in the spectrum through an algorithm based "Chemometry". A series of measurements are performed with known concentrations to generate a "calibration data set". A mathematical algorithm yields the optimal transformation from spectrum to concentrations for the data set. Then, from a new set of spectra, the concentrations can be calculated. Models are generated through statistical treatment of data and multiple correlation, and multiple wavelength linear regression analysis.
The mathematical software to accomplish this multivariate analysis is called Chemometrics, which uses methods such as Partial Least Squares (PSL), Principle Component Analysis (PCA). If the true concentrations are known, the error of the method can be calculated and averaged. This error is the “validation error”.
Experimental Data
1. H2O2 Concentration Measurements in Slurry Blend
In the first series of experiments, the blend of 50 % by volume of Cabot Microelectronics Semi-SperseⓇ W2000 slurry and 50 % DI water, was mixed with various amounts of 30% wt H2O2. Experiments were performed using 2 methods. In the first case, the 3-component mix was manually filled into the measurement cell, whereas in the second case, H2O2 was added to a container from which the slurry was circulated through the cell. The H2O2 level in the blend was measured using bench titration in duplicate. Preprocessing of the signals resulted in validation errors for the two data sets as 0.05 and 0.07 % wt H2O2. This also includes the error in the manual titration, which was about 0.05 % wt H2O2.
This error is the squared sum of the error of the method and the error in the manual titration. Figure 2 presents calculated versus the independently measured wt % H2O2, for calibration and validation data sets. The X and Y error bars for data set 1 are set to 0.01 % and 0.04 %, respectively, whereas, the X and Y error bars for data set 2 are set to 0.05 % and 0.06 %, respectively.
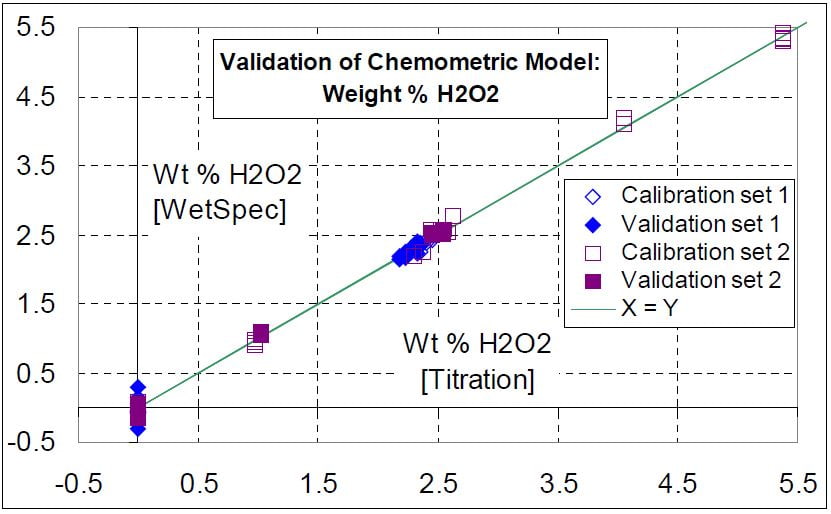
Figure 2. Calibration and Validation Data Sets for Hydrogen Peroxide in Slurry Blend.
2. Measurement of Large Particle Characteristics in PSL Bead Solutions
Polystyrene latex (PSL) particles of 90 and 560 nm diameter (Duke Scientific, Palo Alto, CA) were mixed with de-ionized water in various concentrations and corrected for the temperature-dependent water spectrum. Measured spectra were used to build a model. One model could be built, capable of predicting both size particle concentrations imultaneously, employing proprietary pre-processing of data. Figure 3 shows the results for both bead sizes.
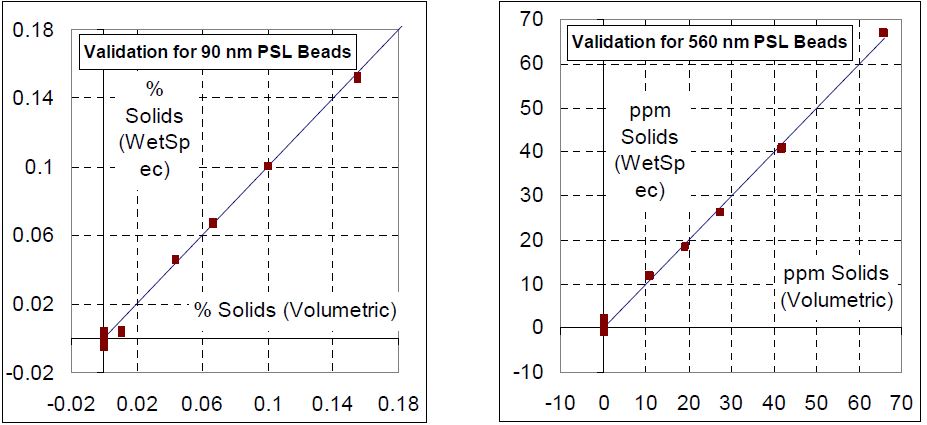
Figure 3. Particle Size Model for PSL Bead Solution.
In Figure 3, the horizontal axis is the known concentration, while the vertical axis presents the model prediction. The prediction error for 90 nm particles was 0.0035 % solids, and for 560 nm particles 0.0001 % solids (12,000 particles per microliter). The quality of the fit was tested by removing each data point in turn, building a model with the remainder of the data, applying that model to the removed data point, and checking the error of the result.
3. Measurement of Large Particle Behavior in a Silica Abrasive Oxide CMP Slurry
A silica-based shear sensitive CMP slurry (~12 wt % solids) was extensively handled (see Figure 5) in pumps to create agglomerated slurry samples (different turnovers and degree of agglomerations) for testing using NIR spectrometry system. Measurements were made using NIR based system in terms of Medium size (~ 0.2 to 1 micron) particle parameter (Am) and Small size particle (< ~ 0.2 micron) parameter (As) to determine the Large particle index (LPI = Am/As). The results of LPI (a measure of an increase in large particle counts in slurry) for different samples were plotted as a function of the cumulative LPC measurements (Ac) obtained using SPOS measurement based unit (AccuSizer™ 780APS).
The plot of LPI versus Ac, Figure 4, shows a nearly linear relationship, suggesting that NIR spectrometry may be able to detect the increase in large particle concentration in agglomerated silica slurries. Further in-depth measurements would be needed to develop more insight and conclusive information on this observation. Large particle distributions were measured by NIR spectrometry during silica slurry extensive handling test using a double diaphragm airdriven pump.
The results are presented in Figure 4, for 4 time points (0, 4.5, 93, and 120 Hours; 0, 143, 2950, and 3800 Turnovers, respectively) samples from this slurry extensive recirculation in a close loop. Slurry in real life fab operations is typically consumed in ~100 turnovers [6]. Presented NIR system enables real-time measurement of abrasive and chemical properties of the slurry blends and could be a very cost effective tool in reducing CMP CoO and yield loss, through continuous monitoring and control of slurry heath during slurry distribution.
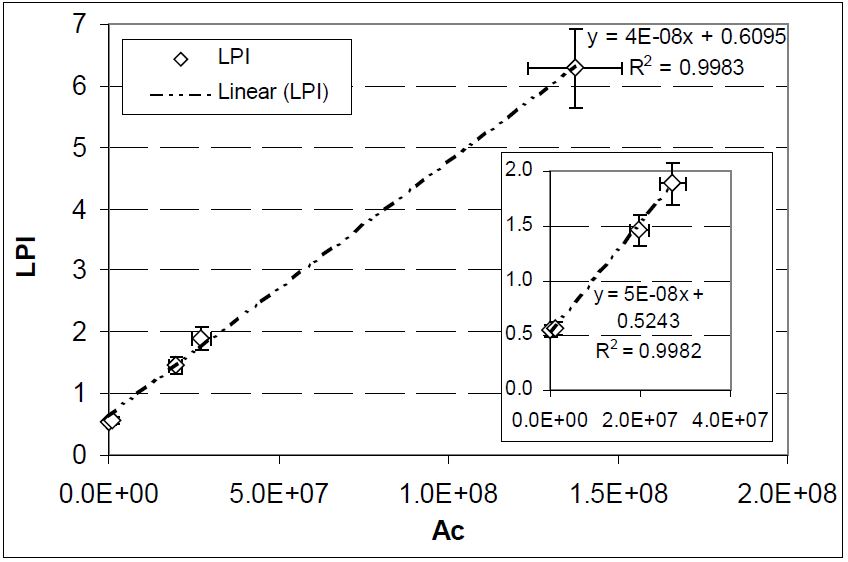
Figure 4. Large Particle Behavior in a Silica Abrasive CMP Slurry.
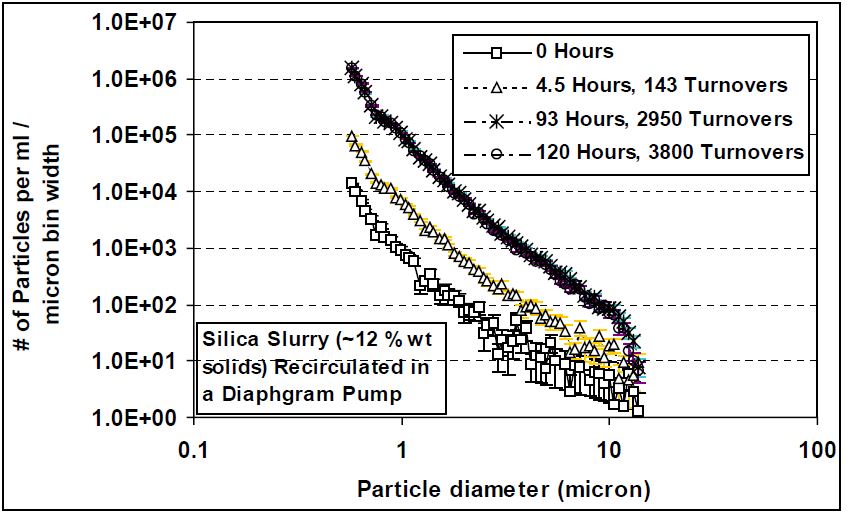
Figure 5. Large Particle in Silica Slurry Samples from Diaphragm Pump Extensive Handling Test for 120 hours (3800 turnovers).
Concluding Remarks
The NIR Spectrometry based approach presented in this paper has shown the ability to measure hydrogen peroxide (oxidizer) level in the CMP slurry and hydrogen peroxide blends, for the concentrations of 0-5 % wt H2O2, and to the accuracy of ~0.05 % wt. This technique has also demonstrated the ability to measure the concentration of 560 nm PSL microspheres (typical size of agglomerated slurry particles) in the presence of 90 nm PSL microspheres (typical for good slurry particles) in the range from 0 to 0.01 % solids, and with an accuracy of 0.0001 % solids.
Results of a large particle index (LPI) obtained using NIR analyzer data show a linear correlation with the cumulative LPC measured using a single particle optical sensing particle analyzer. Presented technology enables simultaneous measurement of abrasive as well as chemical properties of the slurry blends in real-time and could prove to be a very cost effective tool in reducing CMP consumables cost of ownership and yield loss, by continuous monitoring and control of slurry heath during fab slurry distribution.
REFERENCES
[1] Johl, B., and Singh, R.K., Optimum process performance through better CMP slurry management, Solid State Technology, August 2003, pp. 63-66, 2003.
[2] Singh, R.K., and Roberts, B.R., CMP Slurry Metrology: Various Approaches, in Proc. of the 2nd Int. AVS ICMI Conf., Paper CM-TuM12, Santa Clara, CA, February 5-9, 2001.
[3] Singh, R.K., and Roberts, B.R., Behavior of CMP Slurry Properties in Continuous Blending and Distribution Systems, in Proc. of the 17th Int. VMIC Conf., T.E. Wade, Ed., pp. 545-547, 2000.
[4] Nicholes, K., Singh, R.K., Grant, D.C., and Litchy, M.R., Measuring Particles in CMP Slurries, Semiconductor International, July 2001, pp. 201-206, 2001.
[5] Singh, R.K., and Roberts, B.R., On Extensive Pump Handling of Chemical-Mechanical Polishing Slurries, in Proc. of the 12th Annual IEEE/SEMI ASMC, Munich, Germany, April 23 – 24, 2001.
[6] Roberts, B., Singh, R.K., Pierce, A., and Blachier, O., Slurry Quality and Consistency in Continuous Blending Distribution Systems, in Proc. of the 16th Int. VMIC Conf., paper
109/99/0495 (c), T.E. Wade, Ed., pp. 495-500, 1999.
[7] Singh, R.K., Conner, G., and Roberts, B.R., Handling and Filtration Evaluation of a Colloidal Silica CMP Slurry, Solid State Technology, November 2004, pp. 61-66, 2004.
[8] Singh, R.K., High-Retention Filtration of CMP Slurries, Semiconductor International, Vol. 28 (9), pp. 47-53, 2005.